RPi GPIO & TX Timeline
Overview
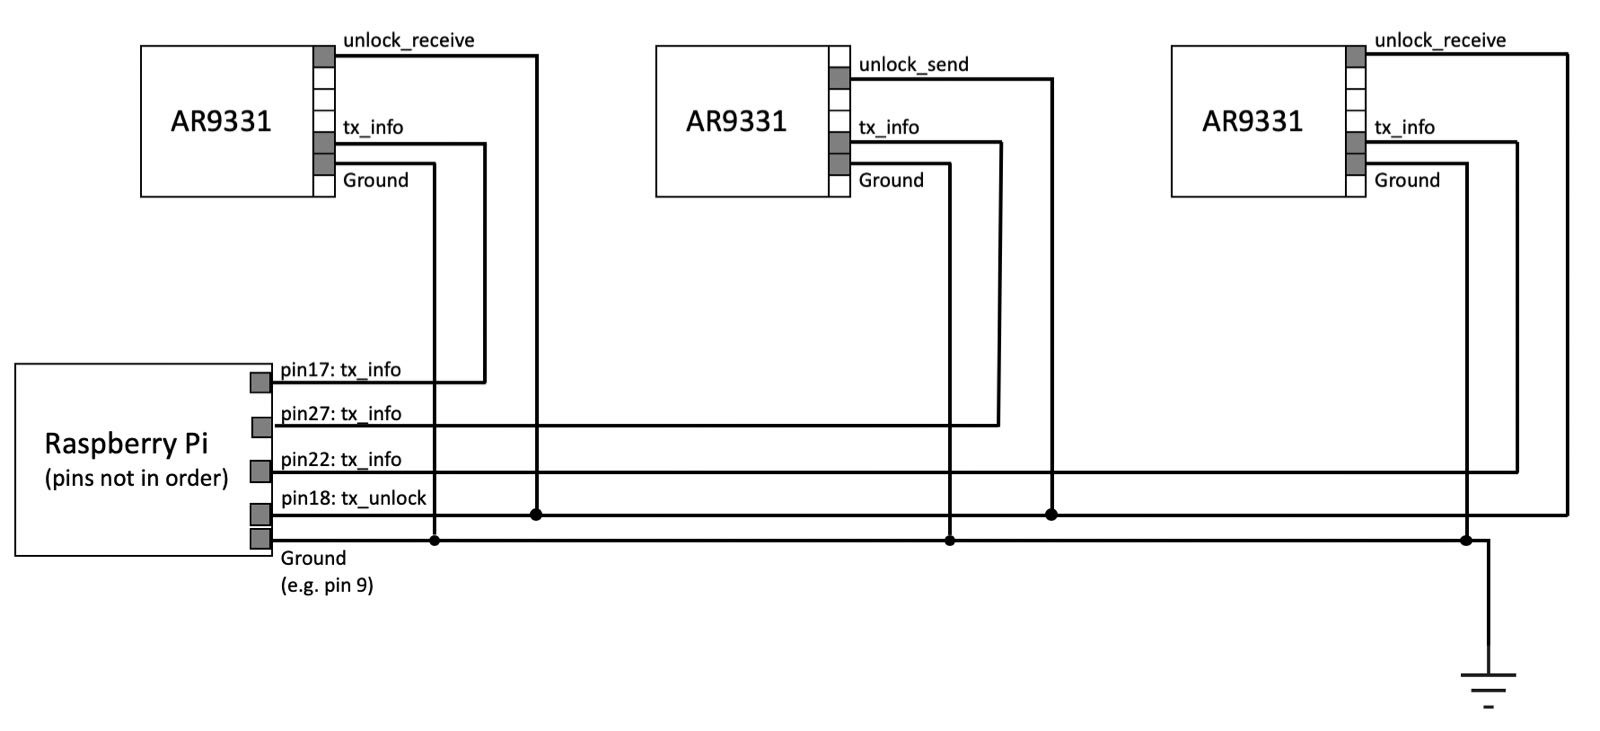
It is important to keep track of the transmission timeline of the nodes while conducting experiments, which provides info of the finish times of packet transmissions. In the current setup, all nodes connect to a Raspberry Pi via GPIO and send a GPIO pulse once a packet has finished transmission (at TX_OK interrupts); the RPi then generates transmission timeslines for the nodes.
Getting started
Compiling
-
Clone the repo here.
-
Run
makeat the project root directory.
Common issues during compilation
Kernel headers for running kernel version does not exist
Error message
make: *** /lib/modules/$(uname -r)/build: No such file or directory.  Stop.
make: *** [all] Error 2
Resolution
This is becuase your recent rpi-update updated the firmware to a version with a “too-new” kernel version, and command apt-get install raspberrypi-kernel-headers installs an older kernel header.
You need to first look into the /lib/modules directory and find which version has the correct, full kernel headers:
cd /lib/modules
find ./ -name build
then downgrade the firmware to the one with that kernel version with the build directory (in this example, version 5.10.63):
sudo rpi-update 64132d67d3e083076661628203a02d27bf13203c
Note that the hash specifies the firmware version, which can be found here at: https://github.com/Hexxeh/rpi-firmware/commits.
Basic usage
- Connect the nodes to the RPi via GPIO wires, e.g.:
- Load the monitoring kernel module
insmod gpio_timeline.ko - Start monitoring GPIO pulses
# start capturing [frame count] frames' timeline data (e.g. 3000) echo [frame count] > /sys/module/gpio_timeline/parameters/max_log_count - Read monitoring info sent to the kernel ring buffer with
dmesg
Generate TX timeline visualizations
The TX timeline data outputted to the kernel ring buffer is massive and unreadable. There is a Python script available that generates visualization from the data.
- Load the monitoring module in non-human-readable form to avoid overheads
insmod gpio_timeline.ko human_readable_output=0 - [Optional] Switch the monitoring module to non-human-readable form to avoid overheads (if the module has already been loaded)
echo 0 > /sys/module/gpio_timeline/parameters/human_readable_output - Clear the currrent kernel ring buffer
dmesg -c - Start monitoring GPIO pulses
# start capturing [frame count] frames' timeline data (e.g. 3000) echo [frame count] > /sys/module/gpio_timeline/parameters/max_log_count - After a few seconds, save the timeline data in the kernel ring buffer to a file (e.g.
/tmp/data)dmesg -c > /tmp/data - Generate the visualization. Note that by default the script focuses on only the mid node and looks for
data.txt, change those in the script if needed.python draw.py